Traceback Highlighting
DendROS automatically detects Python tracebacks in ROS 2 output and applies distinct colors to make them stand out from the surrounding log noise.
This is configured via traceback_color in ~/.config/dendROS/defaults.yaml (or via dendros config):
What it looks like
Modes
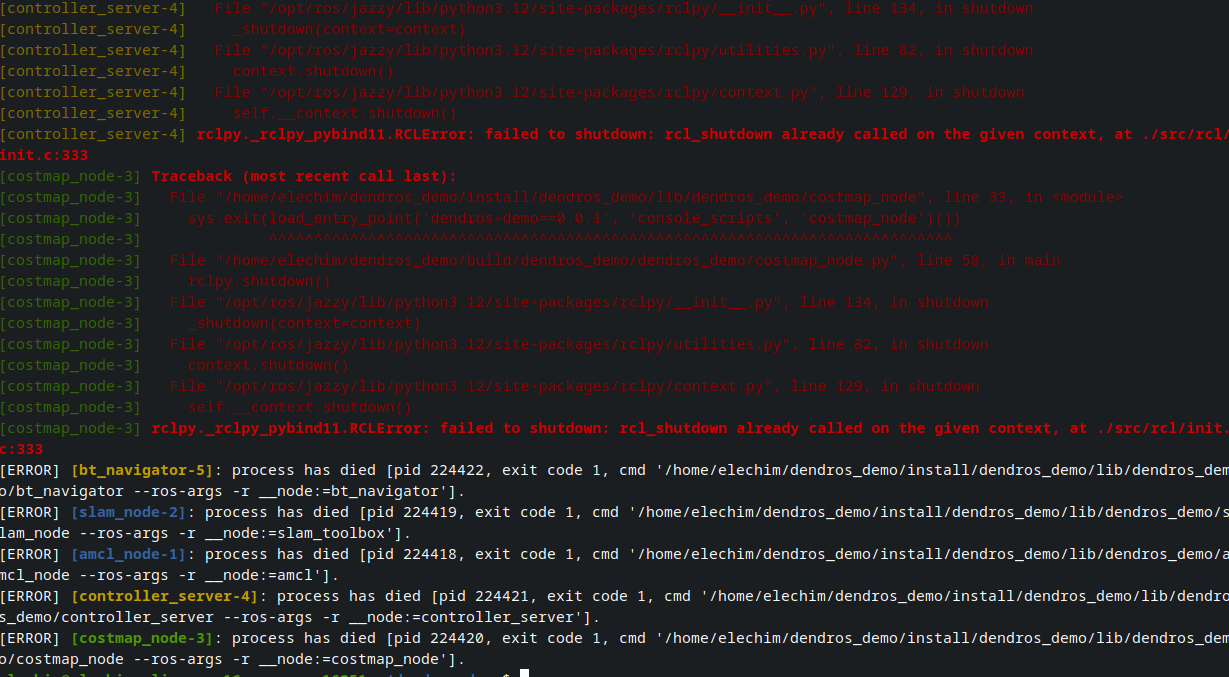
Header and exception lines are shown in bold red.
Frame lines (the indented File …, line …, in … / code lines) are shown in dim red.
This makes it immediately clear which line is the key error vs. which lines are context frames.
The entire traceback block — header, frames, and exception line — is shown in bold red.
Good for high-noise terminals where you want a visually loud, uniform color.
Node-prefixed tracebacks
ROS 2 launch prefixes each output line with the node name, including traceback lines:
[my_node-1] Traceback (most recent call last):
[my_node-1]   File "/opt/ros/humble/lib/my_pkg/my_node.py", line 42, in run
[my_node-1]     result = some_function()
[my_node-1] ValueError: something went wrong
DendROS handles this correctly:
- The
[my_node-1]prefix is kept but dimmed (a darker version of the node's group color). - The traceback content after the prefix is colored according to the selected mode.
This preserves node identification while making the traceback structure visually clear.
Configuring via dendros config
The setting is exposed in the TUI under System:
| Setting | Values |
|---|---|
| Traceback color | fancy / red / off |
Notes
- Segmentation faults (
Segmentation fault (core dumped)) and other C-level signal output are not treated as Python tracebacks and pass through unchanged. - ROS 2 shutdown tracebacks triggered by
Ctrl-Care captured and colorized — the pipe drains all remaining output before exiting. - The
offmode is a strict passthrough: no state machine is entered, so there is zero overhead and zero risk of misidentification.